
COVID-19 has changed the dynamics of the restaurant industry, with quarantine and shelter-in-place orders leading some to increase the amount of food they’re ordering in, while others hesitated to have any contact with even delivery workers. CE Vision provides the unique ability to look at individual transactions by restaurant and by delivery service in order to give users a more wholistic view of trends.
Although all restaurant subindustries plunged into negative y/y spend growth in March, pizza restaurants, which have been more delivery-driven than other subindustries even historically, were the only businesses to show a strong recovery of 13% y/y spend growth in April. Quick service chicken restaurants, which had shown the strongest y/y spend growth in January and February, also showed the smallest declines in March but lagged behind pizza growth in April and May. By September, quick service chicken, pizza, and burgers were the only restaurant subindustries showing sizable positive y/y spend growth. Family dining showed by far the largest y/y declines, with spend still down -42% y/y in September, followed by fine dining at -27% and upscale casual dining at -23%.
Restaurant Industry


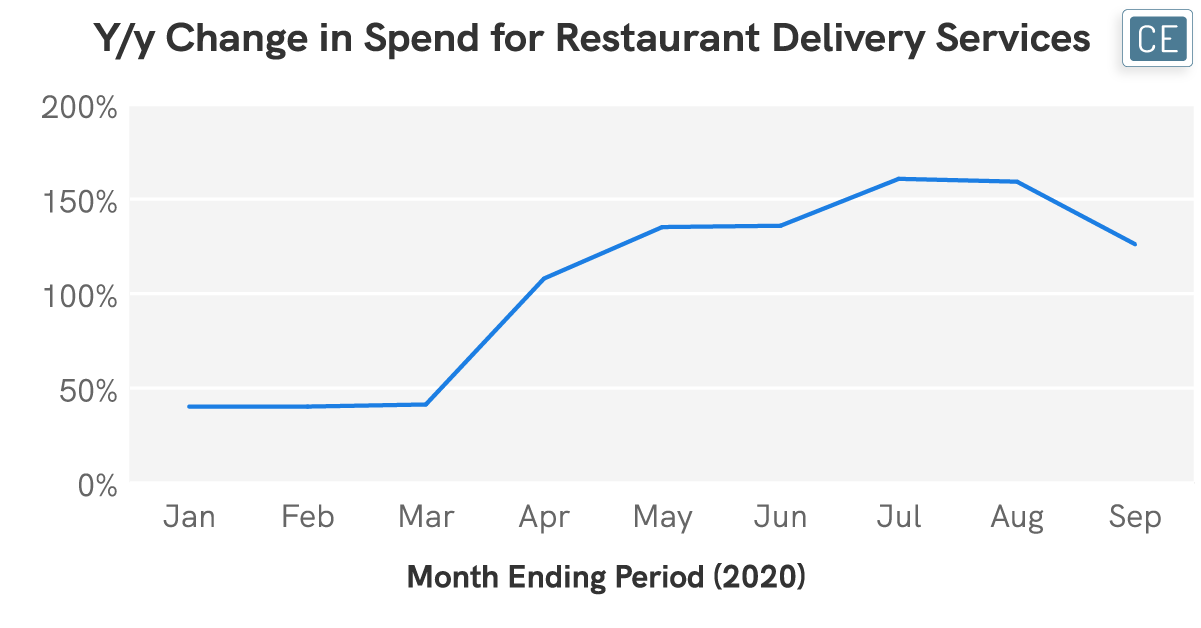
Note: Top delivery services defined as: Uber Eats, DoorDash, Grubhub.com, Favor Delivery, and Postmates
While overall spend for restaurants suffered, delivery services flourished. Y/y spend growth accelerated from around 40% in January through March to over 100% in April, around 135% in May and June, and peaked around 160% in July and August before slowing slightly to 125% in September. Among the factors contributing to this growth, one of the most interesting has been an increasing concentration in transaction frequency for existing users. This may be especially favorable for the delivery services as they have historically relied on expensive promotions and discounts to acquire new customers, so loyal repeat business could drive increasing profitability. In January, February, and March, the largest growth in individuals ordering from delivery services was among those ordering just once – 46% y/y growth in January, 40% in February, and 37% in March. In April, that dynamic reversed, with the most engaged shoppers ordering five or more times per month increasing the fastest – 74% y/y growth in April, 96% y/y growth in May, and more than doubling in June through September.
Transaction Frequency

Note: Transactions per customer at Uber Eats, DoorDash, Grubhub.com, Favor Delivery, or Postmates
Although delivery service growth is becoming more concentrated in terms of more transactions for specific individuals, that growth is coming from a broad demographic mix. Every single age group tracked in our data has seen spend at delivery services more than double every month since April. In many of the last few months, including August and September, the highest spend growth came from those aged 65+. This group’s spend grew almost 200% in August y/y before decelerating to a still-sizable 150% in September.
Demographics

Note: Spend at Uber Eats, DoorDash, Grubhub.com, Favor Delivery, or Postmates
While it is important for companies to understand trends for themselves and their competitors, it can be just as important for them to understand what is happening with potential partners. While delivery brands can use our data to see how they are doing versus competitors and whether they are keeping up with the same growth drivers, restaurants should also be paying careful attention to these metrics. It can help inform whether to partner with a distribution service at all, how to think about customer acquisition costs and loyalty with that service, and how to market the partnership. It can help restaurants to see whether a delivery partnership has the potential to open up channels to new customers in addition to increasing spend from existing demographics. These considerations should be important not only as delivery became increasingly popular due to the pandemic, but also in light of its continuing popularity as in-restaurant dining has reopened.