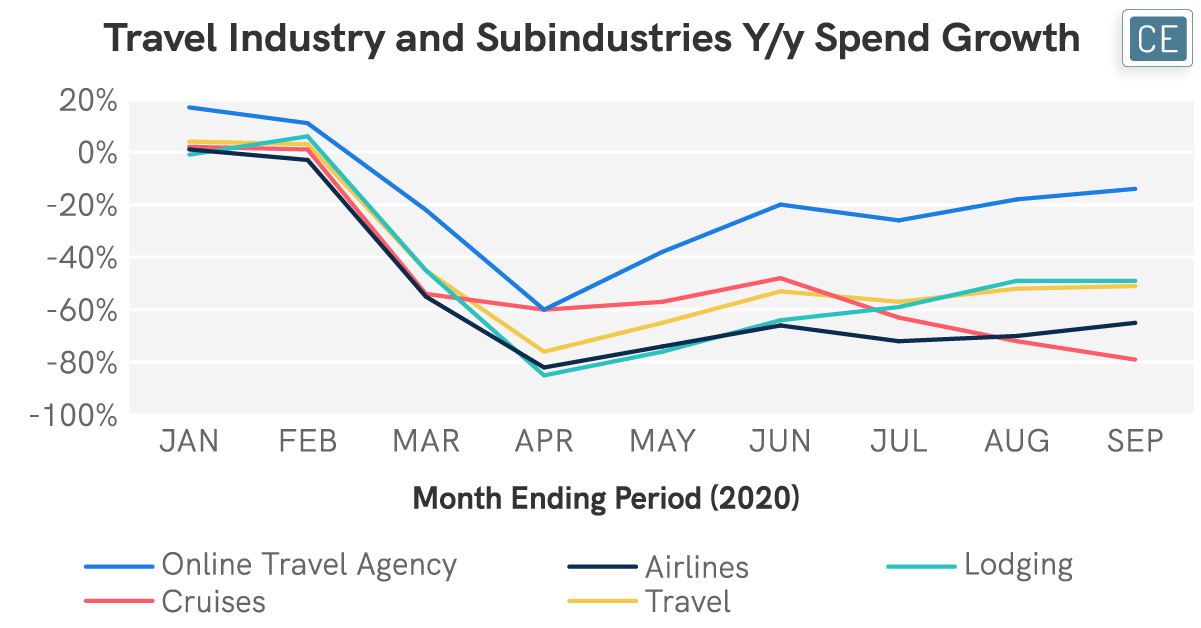

Although many sectors of the economy have seen declining sales due to the COVID-19 pandemic, the travel industry has arguably borne the worst of the declines. Cruises have been the worst-hit, with spend down -80% y/y in September. Airlines have not faired much better, with spend down almost two-thirds. Yet, other parts of the travel industry are doing comparably better. Spend for Lodging has recovered since April to half of its level last year and Online Travel Agency spend is only down -15%. This implies that many consumers are still planning trips, just closer to home.
Travel Industry

The CE Vision platform offers the unique capability to examine spend trends by behavioral characteristics in addition to demographics. Looking at Lodging spend for those who had spent money on a flight versus those who did not provides further insight into how vacationers may differ from staycationers. In general, those who spent money on a flight also spent more on lodging over the summer travel months June – August. This may imply a longer trip or more disposable income for upgraded accommodations. The one exception to this is 18-24 year olds, who spent about the same amount on lodging whether there was a flight involved or not. By income, the lowest income travelers had the largest differential in spend per shopper when there was a flight involved versus not, but this was followed by the highest income shoppers with the second-highest differential. Finally, those with children in their household who flew had a larger differential in their lodging spend versus those who didn’t fly than those without children in their household.
Vacation vs. Staycation Demographics


Of course, tourism doesn’t only affect the travel industry itself – entertainment and restaurants are among the many sectors that benefit from increased travel. And, a shift to more local travel isn’t necessarily bad for every business. By looking at which brands are most frequently shopped at on the same day a cardholder also makes a lodging purchase, and by looking at only cardholders who didn’t book a flight, we can identify which businesses may actually see a benefit from staycation trends. Car rental companies and online travel agencies appear to be the biggest beneficiaries, as these traditional travel businesses are still often necessary even for local trips. Travel stops that might otherwise be considered the province of truckers such as Love’s, Pilot, Buc-ees, and TA also show up high on the list. Restaurants that tend to be in roadside plazas and along major highways also get their fair share of business from staycationers. Starbucks, Cracker Barrel, Denny’s, IHOP, and Waffle House all saw a relatively large percentage of non-flyers visit on the same day as they made a lodging purchase.
Brand Basket


Note: 1/1/2020-10/11/2020; % of shoppers who made a Lodging purchase who also made a purchase at listed brand on the same day; filtered by shoppers who had zero airline purchases 12/1/2019-10/11/2020
It is very important for companies to understand changing consumer behavior. CE Vision allows users to segment shoppers based on where they did and did not purchase, giving a more insightful view into not only demographic, but also behavioral patterns that they can leverage to better understand what is happening in their businesses. This can help them shift marketing spend into the appropriate channels and come up with promotions that better target emerging customer segments. It can help them understand why certain locations or channels are performing better than others and adapt their strategies.